Performance Indicators: Widening participation of under-represented groups
Indicators for Widening Participation are published today on our website.
The full tables show the indicators for every publicly funded HE provider in the UK alongside their benchmark.
Table T1a shows the percentage of entrants in 2014/15 from state schools, lower socio-economic classifications (SEC) and low participation neighbourhoods. This table is restricted to young (under 21), UK domiciled entrants to full-time first degree courses. Further tables show the statistics for entrants with different characteristics and for other undergraduate courses.
The latest statistics show that of all UK domiciled, young, full-time, first degree entrants in 2014/15:
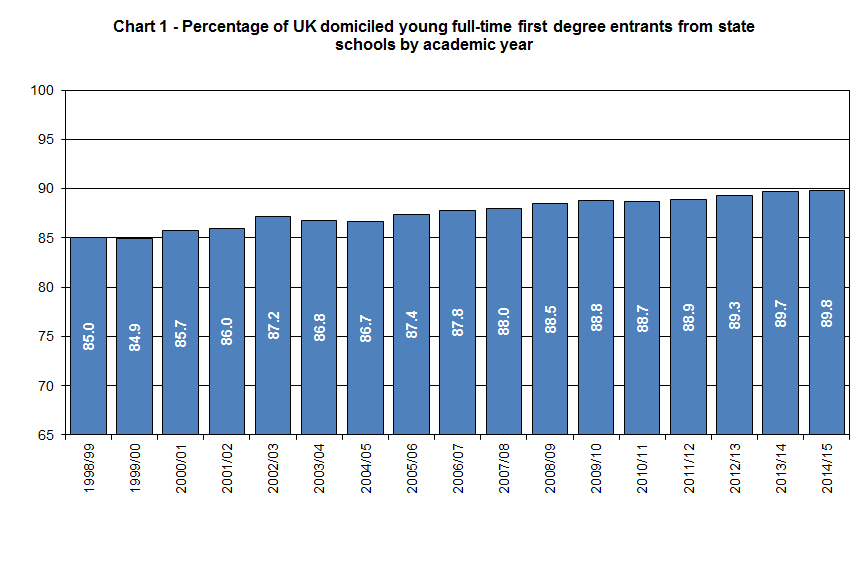
- 89.8% were from state schools. Two thirds of HE providers had over 90% state schools entrants.
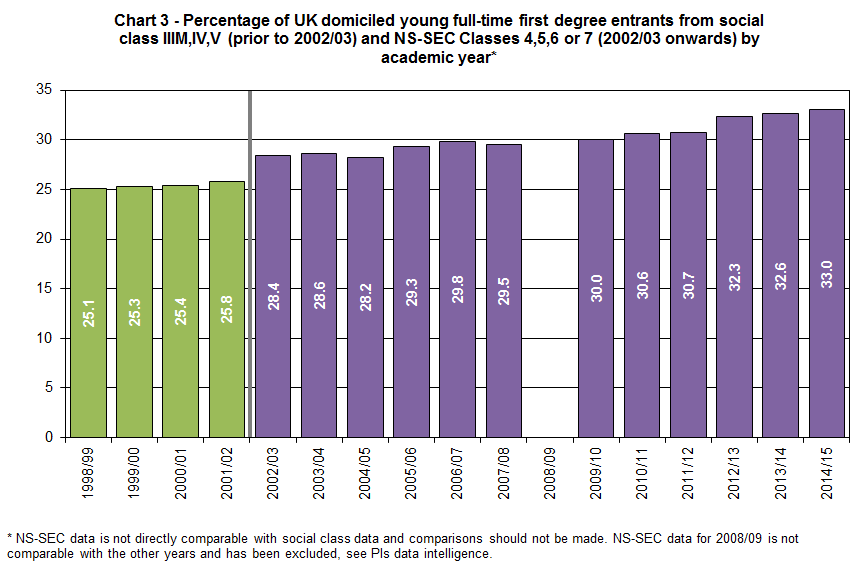
- 33.0% were from NS-SEC classes 4-7. This proportion varied from 10.0% to 58.3% across HE providers.
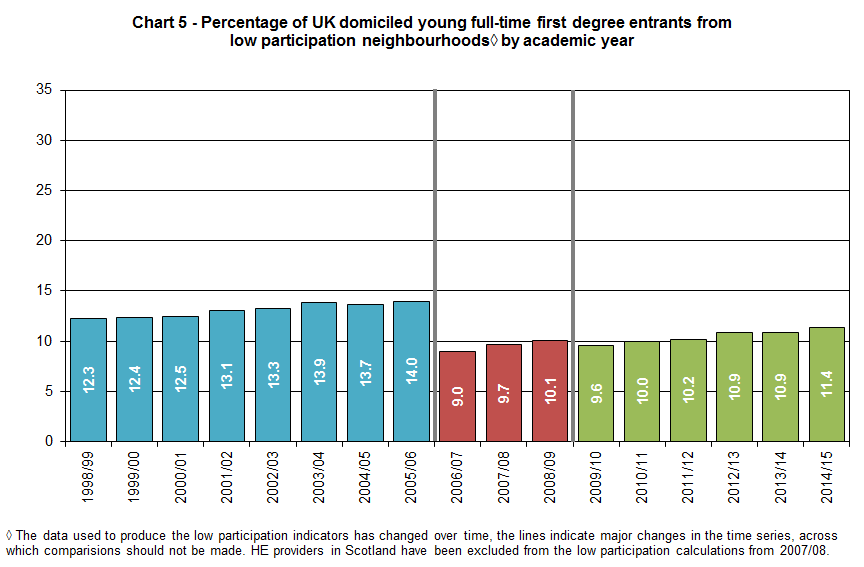
- 11.4% were from low-participation neighbourhoods.
The graphs below from the UKPI summary page show the trends for UK domiciled, young, full-time, first degree entrants for the years 1998/99 to 2014/15.
State Schools

National Statistics Socio-Economic Classification

Low-participation neighbourhoods

More Widening Participation summary tables and charts can be found here. The full HE provider level tables are available here.
Non-continuation rates for 2013/14 entrants will be published on Wednesday 23 March 2016.
Notes for Editors
- Press enquiries should be directed to:
- Simon Kemp
- HESA Press Officer
- 01242 211120
- [email protected]
- Technical enquiries should be directed to:
- HESA PI team
- 01242 211115
- [email protected]
- The Guide to UKPIs explains what the UK Performance Indicators are, and why they are produced.
- The UKPI tables include a Benchmark for each HE provider. This is a sector average adjusted for the type of HE provider in question. The benchmarks are not government targets or quotas. See the Guide to UKPIs for more information, or the Benchmarks page for full technical details.
- Definitions of the terms used in this press release can be found in PIs Definitions.
- Information on changes affecting the time series of performance indicator statistics can be found in PIs Data Intelligence.
- The UK Performance Indicators are defined and specified by the UK Performance Indicators Steering Group (UKPISG).
- The second tranche of UK Performance Indicators covering Non-continuation rates for 2013/14 entrants will be published on Wednesday 23 March 2016.
- The third tranche of UK Performance Indicators covering Employment of Graduates will be published on Thursday 7 July 2016.
About the UK Performance Indicators
UK Performance Indicators are a range of statistical indicators intended to offer an objective measure of how a HE provider is performing. They are not 'league tables' and do not attempt to compare all providers against a ‘gold standard’ or against each other. There are indicators for all publicly funded HE providers in the UK. For more details and FAQ see the Guide to UKPIs
About HESA
The Higher Education Statistics Agency (HESA) is the recognised source of data on higher education in the UK. Our experts collect, analyse, and disseminate accurate and comprehensive statistical information on all aspects of UK higher education in order to support the strategic aims of our users and enhance the effectiveness of the sector as a whole. We are a charity and a company limited by guarantee. We operate as an independent organisation, working in close partnership with higher education providers, regulators, funders, government departments, policy makers, and other stakeholders.

Press Officer
